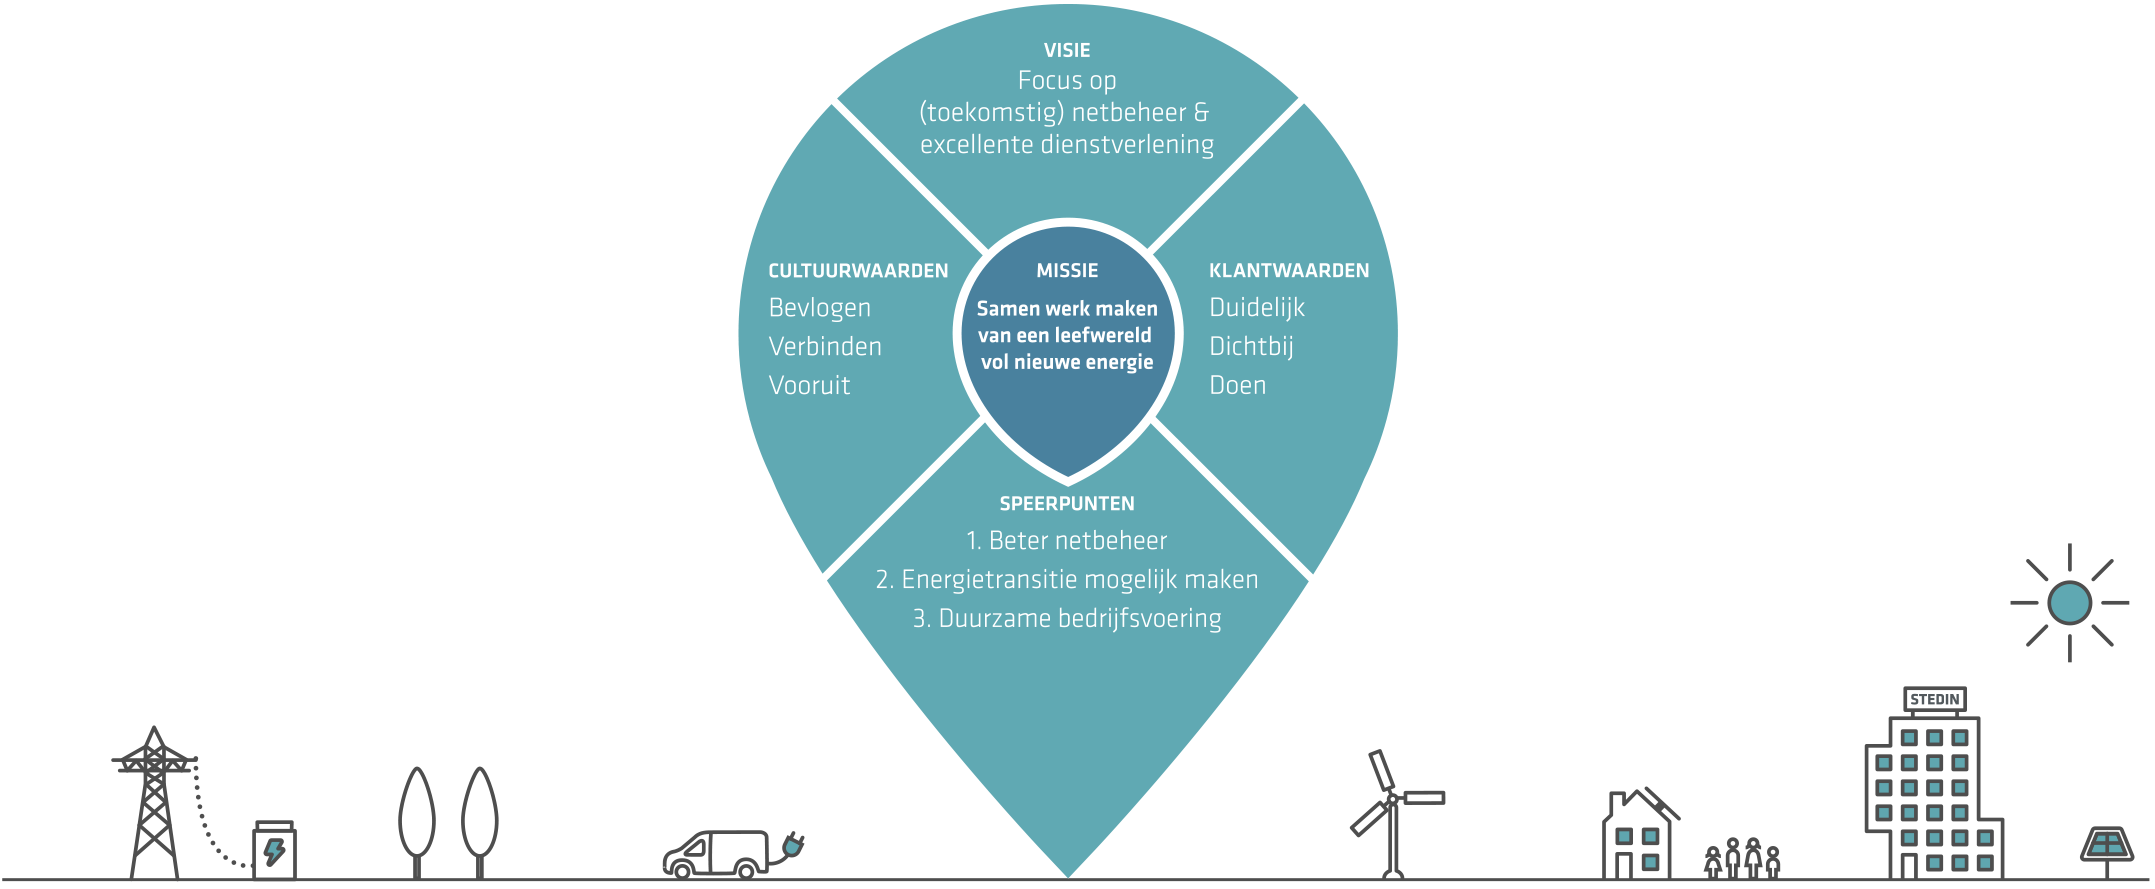
Value creation and measuring impact
Stedin Group's value creation model is based on the six capitals of the <IR> model. Stedin Group's actions have a positive as well as a negative impact on society. For each capital, we show our key input topics and output results. We also highlight our value for society.
INPUT | |||||
|---|---|---|---|---|---|
|
|
|
|
|
|
|
|
|
|
|
|
 OUTPUT | |||||
|
|
|
|
|
|


Positive and negative impact on society
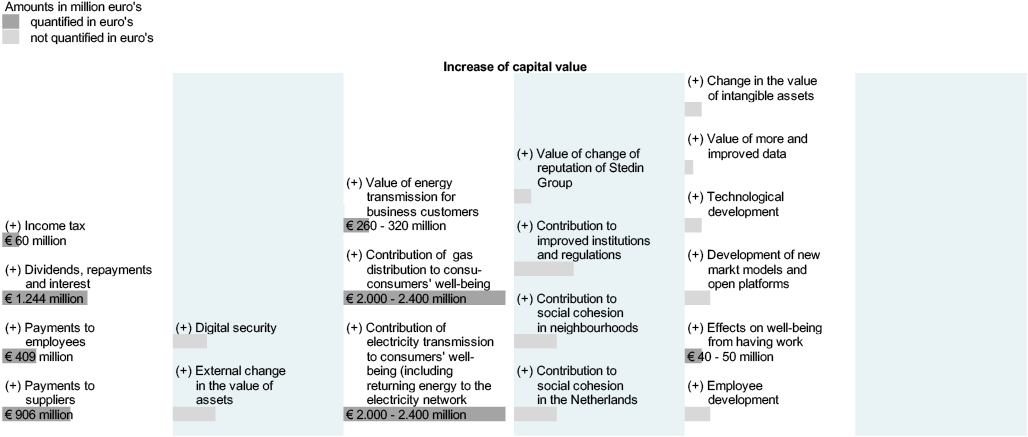
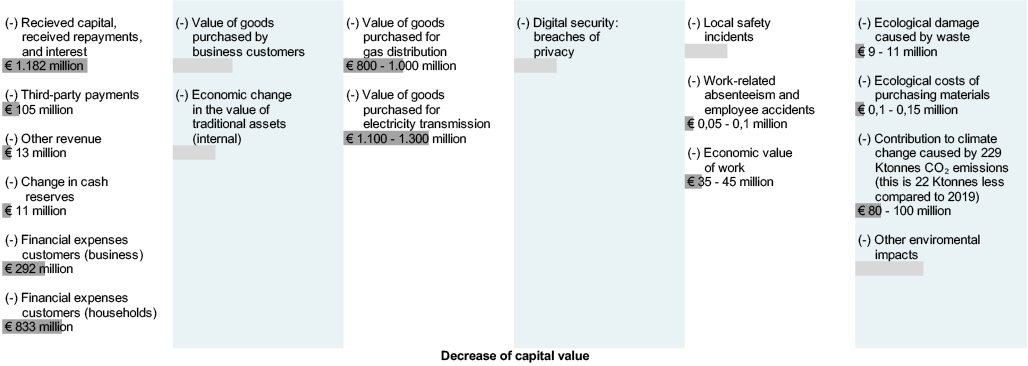
The table below provides qualitative as well quantitative insight into the added value of our social impact on stakeholders. The six capitals in the centre of the table represent the baseline. The increased value due to the benefits of what we do for society is shown above the baseline, and our decreased value consisting of the costs as well as any inconvenience associated with what we do is shown below the baseline. The information under the category 'Financial, economic' is in line with the IFRS figures from the 2020 financial statements and is quantitative. Our qualitative indication of all unquantified impact offers insight into the relative scope of our social impact on society. We explain the six capitals and the way in which they cause capital value to increase or decrease in an overview on the following pages. Through our impact, we contribute to the UN Sustainable Development Goals.
IMPACT |
|---|
|
|
|
|
|
|
|---|
Result of impact measurement | ||
|---|---|---|
Concept | Increase of capital value | Decrease of capital value |
Financial, economic | ||
Incoming and outgoing cash flows have a positive as well as a negative impact on society (SDG 7, 8, 11). | Payments to suppliers and employees, tax paid, negative cash flows, dividends, interest and repayments are considered to be capital that is invested in society, for a total of € 2,619 million. | Capital raised for the financing of activities, third-party payments, other revenue as well as financial expenses for both business and private customers are considered to be capital that is withdrawn from society. |
Infrastructure | ||
This category involves our regulated assets and is quantified in the IFRS financial statements (SDG 9). | By investing in digital security, Stedin minimises undesirable data exchanges. As a result, the online security of society improves. | If raised capital is invested in our material assets, the value of these assets increases. This value increase represents capital withdrawn from society. |
The value of our assets changes – for example, due to the expected positive impact of smart meters. This value change also applies to society. | The products and services intended for our infrastructure, which Stedin receives from suppliers, increase in value as a result. These products and services cannot be invested in society. | |
Customer and service provision | ||
Our standard business operations and their design affect the daily lives of our customers (SDG 7, 9, 11, 12). | The availability of energy contributes to the welfare and well-being of private as well as business customers. In this respect, Stedin creates value for society. Stedin creates between € 4,260 and € 5,220 million of value for society. | The products and services intended for the facilitation of gas distribution as well as electricity transmission, which Stedin receives from suppliers, increase in value as a result. These products and services cannot be invested in society. Stedin withdraws between €1.900 and €2.300 million in value from society. |
Social, relational | ||
Our social capital is defined by how the public values Stedin and our activities. | Improving the reputation of Stedin Group increases customer satisfaction, reduces recruitment costs and creates new opportunities for cooperation. This increases our potential to create long-term value for society. | Leaking privacy-sensitive data has a negative social impact and results in loss of value. |
Employees and intellectual capital | ||
Stedin affects the well-being of its employees both positively and negatively. We also create capital by investing in knowledge development (SDG 8, 11). | Having a job positively affects the well-being of the relevant employee. As an employer, we contribute between €40 and €50 million to the well-being of our employees, and hence to society. | Work-related absenteeism and accidents reduce the well-being of the people involved, as do safety incidents. We cause these situations as an employer and consequently decrease well-being in society. The resulting value is up to €1 million. |
Stedin actively invests in knowledge development for future grid management. This approach raises the value of our immaterial assets, creates new market models/platforms and improves/increases data processing. Its application creates value for us and for society. | All employees devote time to their job. The total value of this time is between €35 and €45 million. Since this time cannot be spent elsewhere, we withdraw its value from society as an employer. | |
Climate, nature and environment | ||
Our normal business operations affect the climate, nature and the environment (SDG 12, 13). | In 2020, our normal business operations emitted 229 Ktonnes of CO2, which has a negative impact on the climate, nature, the environment and hence society. | |
As we are unable to recycle 100% of the materials used, the resulting waste causes ecological damage. |