One Planet Thinking
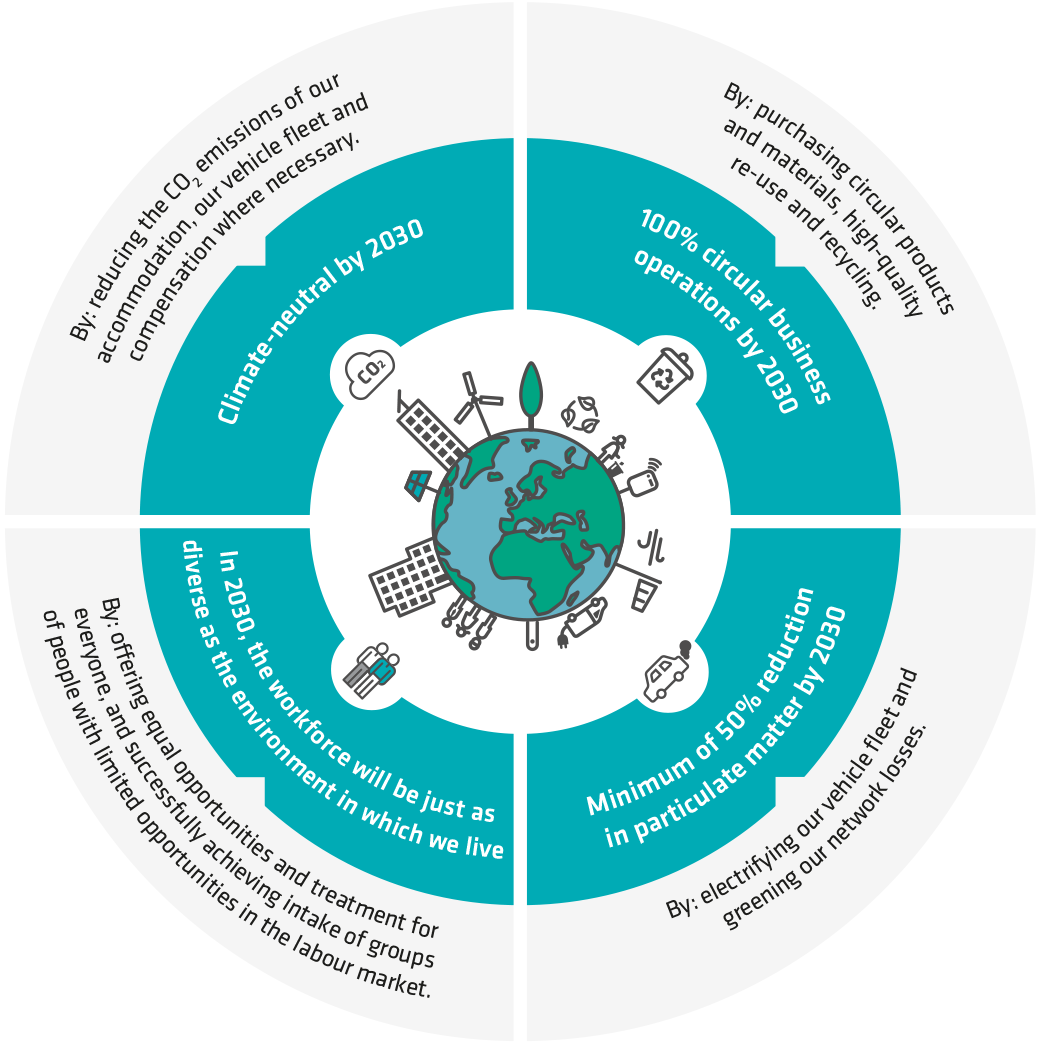
We are making progress towards climate-neutral business operations in 2030. We are committed to facilitating the energy transition while also enhancing the sustainability of our business operations. In this way, we are building a future-proof society. We formulated our One Planet strategy to reduce our environmental impact.
We concentrate our efforts on those areas in which our impact is greatest: CO2 and particulate matter emissions, use of raw materials and an inclusive society. The steps that Stedin Group is taking as part of its commitment to working for equal opportunities and long-term employability for all are described in the section on Vital employees in a changing environment.
In 2020, we additionally explored the potential for leveraging our activities to provide stimulus for the restoration of biodiversity in our service area. You can read more about this at the end of this section.
One Planet KPIs
Stedin Group manages its One Planet strategy through key performance indicators (KPIs). The table below shows the KPIs for 2020 and the corresponding results.
| 2018 | 2019 | 2020 | |
|---|---|---|---|---|
Compensation of network losses electricity | Target | 100% | 100% | 100% |
Realisation | 100% | 100% | 100% | |
Reduction of One Planet CO2 emissions (base year 2018) | Target | -14% | -9% | -18% |
Realisation | -2% | -13% | 246% |
| 2018 | 2019 | 2020 | |
|---|---|---|---|---|
Purchasing volume of primary assets transparent via raw materials passport | Target | n/a | 18.0% | 100% |
Realisation | n/a | 63.7% | 96.5% |
Science Based Targets
In 2019, we established on the basis of an analysis carried out by the Navigant (now renamed: Guidehouse) consultancy that, in the light of our performance and planned measures, we are operating within the Science Based Targets (SBTs). These targets are based on the goal of keeping global warming to 'Well below 2ºC' in 2050 defined by the Intergovernmental Panel on Climate Change (IPCC). This goal is translated into the maximum CO2 emissions per sector (agriculture, industry, energy, etc.) and then into the maximum CO2 emissions per company. In the case of Stedin, this means that we need to achieve a 30% reduction in CO2 by 2030 relative to 2018 levels. Based on the current measures, we are projected to achieve a 33% reduction in 2030. While this is more ambitious than the Paris Climate Agreement objectives, it is still not enough to achieve our own One Planet goals. These calculations do not yet take into account the measures implemented to make the energy mix in the Netherlands greener.
To achieve the SBTs, we are working on further reduction measures to avoid, reduce, green and, where necessary, compensate the CO2 emissions from our gas network losses. We are also advancing the electrification of the larger company vans.
The chart on the following page shows the projected results from our efforts in 2030 with regard to mobility, accommodation as well as leakage loss & network losses. These efforts will result in a 33% reduction relative to the base year, thereby enabling us to achieve the Paris Climate Agreement objectives. In this section, we explain the steps we are taking along this route.
 CO2 and particulate matter emissions
Climate-neutral business operations by 2030 translates to net zero carbon emissions from our accommodation, mobility and network losses. Reduction pathways have been defined with measures that ensure the reduction and greening of emissions in the period up to 2030. Following the allocation of responsibility for network losses from gas distribution with effect from 1 January 2020, the three large grid managers became jointly responsible for purchasing gas for gas network losses and leakage loss as well as the reporting of the related CO2 emissions. It is our ambition to green 40% of gas network losses over a period of seven years from 2020. It may be possible to compensate the remaining 60% through the purchase of certificates; the precise details in this regard are for each individual grid manager to decide. For this reason, we have included the CO2 emissions from our gas network losses in the CO2 emissions from Stedin Group's business operations in 2020 in their entirety. This is the first time we have done so.
CO2 emissions generated by One Planet business operations at Stedin Group
In 2020, Stedin Group's One Planet business operations generated 53,258 tonnes (53.3 Ktonnes) of CO2 emissions (2019: 13.2 Ktonnes). Consequently, we did not achieve our reduction target. This increase was caused entirely by the addition of the statutory responsibility newly allocated to the grid managers to purchase gas to compensate for gas network losses and leakage loss. Stedin Group did not yet use options for greening or compensation of gas network losses in 2020. We are developing a strategy to reduce the CO2 emissions from gas network losses in an acceptable manner.
CO2 emissions generated by our business operations are divided into four main categories:
- consumption of energy and CO2 equivalents in our accommodation;
- consumption of energy and CO2 equivalents in our mobility, which includes our car use, commuting and business travel;
- CO2 emissions arising from the amount of electricity that Stedin purchases for its business operations. The largest contribution comes from our network losses. This is energy that is lost during electricity transmission, which we must then purchase;
- CO2 emissions arising from the volume of gas that Stedin purchases for its business operations. This is energy that is lost during gas distribution, which we must then purchase as of 1 January 2020.
The reporting on CO2 emissions in the chart above for 2017, 2018 and 2019 is based on main categories 1, 2 and 3. In 2020, category 4 was added to this list. Without category 4, Stedin Group's CO2 emissions in 2020 would have been 11,308 tonnes (11,3 Ktonnes), which would have represented a further decrease in line with previous years. The comparative figures for 2019 and 2018 have been adjusted for emission factors (source: www.co2emissiefactoren.nl) where applicable.
Total CO2 emissions by Stedin Group
The CO2 emissions generated by Stedin Group in 2020 totalled 229 Ktonnes (2019: 253 Ktonnes).
Besides the CO2 emissions of our business operations (53.3 Ktonnes), that figure also includes the emissions from generator units (2.5 Ktonnes), our electricity grid (1.0 Ktonnes), purchasing and investments (170.1 Ktonnes) and upstream emissions of purchased fuels, electricity and heat (2.1 Ktonnes). We provide a detailed overview of the CO2emissions by Stedin Group in the table at the end of this section. The comparative figures for 2019 and 2018 have been adjusted for inflation, exchange rates and emission factors (source: www.co2emissiefactoren.nl) where applicable.
Reduction of emissions due to network losses and leakage loss
Network losses and leakage loss arising from the transmission of electricity and distribution of gas account for 18.6% of our CO2 emissions. Stedin is committed to reducing the network losses as quickly as possible. Where possible, we commit to greening as compensation for CO2eq emissions from network losses that we cannot reduce.
In 2020, various projects were undertaken with the aim of reducing or greening network losses. We installed solar panels on the roofs of Enduris's main distribution stations, for example, challenged suppliers in the course of various purchasing processes to deliver components with the lowest possible energy losses and examined measures for curbing network losses further. An example of action taken to reduce network losses is the replacement of our grey cast iron gas mains. This is done for safety reasons but has the additional benefit of preventing network losses, leading to lower CO2 emissions.
Compensation of network losses
Each year, Stedin Group compensates 100% of the CO2 emissions arising from the electricity that we purchase for our electricity network losses. At the moment, we do so by purchasing Guarantees of Origin (GoO). In the longer term, Stedin Group wishes to make the network losses more sustainable by entering into Power Purchase Agreements (PPA). This process involves us purchasing green electricity directly from a sustainable source such as a wind or solar farm. With effect from 2021, we will purchase electricity for 40% of our network losses under such a PPA. This figure should be over 80% by around 2030.
Transport of electricity | Grid losses | Percentage | |
|---|---|---|---|
2016 | 20.270 GWh | 1.020 GWh | 5.03% |
2017 | 21.893 GWh | 1.052 GWh | 4.80% |
2018 | 21.330 GWh | 1.076 GWh | 5.05% |
2019 | 21.100 GWh | 1.069 GWh | 5.06% |
2020 | 20.171 GWh | 953 GWh | 4.50% |
Solar panels on assets of Enduris and DNWG
In the final months of 2020, approximately 2,000 solar panels were installed on 11 high-voltage distribution stations belonging to Enduris. The panels will generate 550 MWh of sustainable energy per year for Enduris and will be used to keep its electrical plant and systems operational. The solar panels will cut the total energy consumption of Enduris's high-voltage stations by 35%. This in turn will reduce our CO2 footprint by 80 Ktonnes of CO2. The panels were only installed on high-voltage stations with ample available capacity for the foreseeable future, so that Enduris does not get in the way of other local initiatives for sustainable energy generation.
One Planet procurement policy
We take responsibility for our chain emissions, such as the emissions that occur at our contractors or that arise during the production as well as the transport of the components and assets that we purchase. We take the CO2 footprint as well as other One Planet issues such as material usage and social working conditions into consideration in our purchasing processes. They form the basis for selecting suppliers. You can read more about this matter in the section on chain responsibility.
Assessing the environmental impact of purchased assets
To deepen our understanding of the impact of our purchased assets and allow us to assess the sustainability performance of suppliers, we teamed up with the other grid managers and CE Delft to develop an Asset Tool. This tool makes it possible to calculate the environmental impact for transformers, cables, pipelines, conductors, stations and switchgear. It also enables us to include the outcomes as an integral factor in sustainability weighting in the tendering process. The tool provides us with better insight into our impact in the chain and enables us to advance improvements in cooperation with suppliers and the sector.
 Particulate matter
Although particulate matter is one of the four main topics of our One Planet strategy, it does not feature as a separate KPI. The reason is that particulate matter emissions are largely linked to our network losses and our mobility. By raising the sustainability of network losses through Power Purchase Agreements and electrifying our vehicle fleet, we will attain our 50% reduction target.
Reduction of CO2 and particulate matter emissions via our mobility
At Stedin Group, mobility is divided into three categories: car use, commuting and business travel. We have a phased approach to making our mobility more sustainable based on the three As of avoiding, adjusting and augmenting the sustainability of what remains.
Making car mobility more sustainable
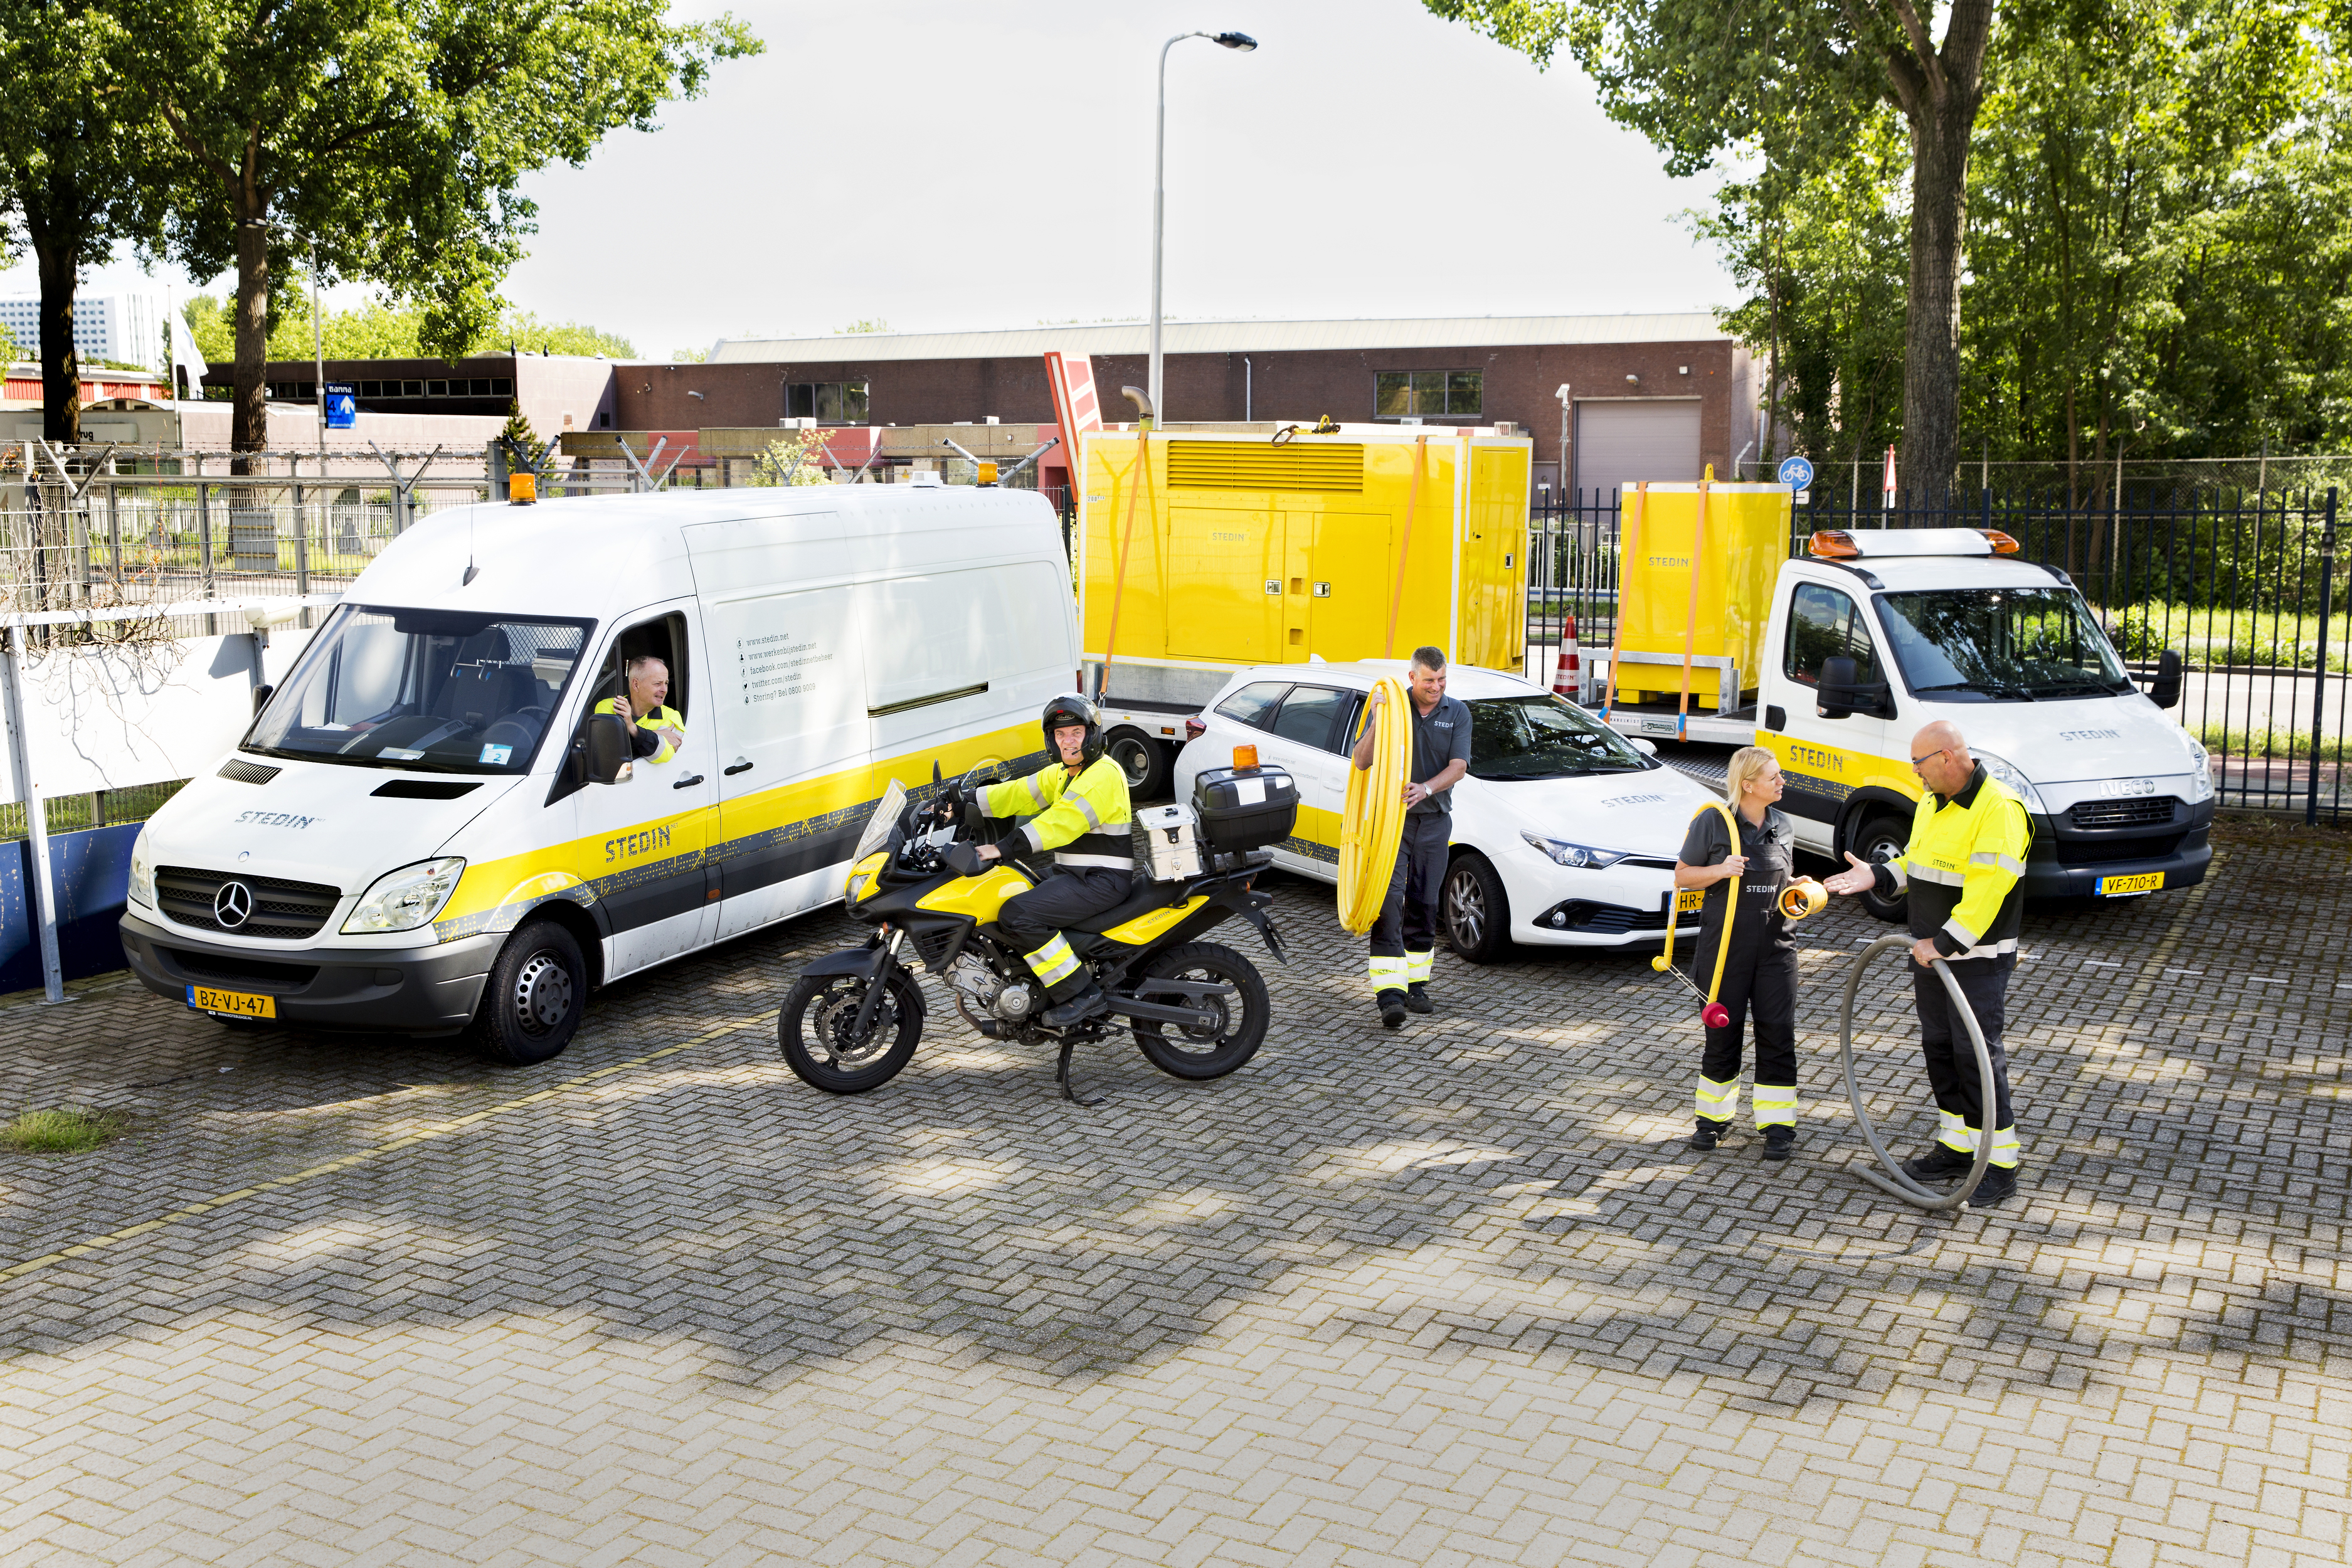
Together with the province of Zeeland, Stedin Group has one of the larger commercial vehicle fleets in the western Netherlands. In 2020, we had 815 lease cars and 1,356 commercial vehicles. Stedin no longer operates one of the 25 largest vehicle fleets. That is good news, since reduction makes the biggest contribution to enhancing the sustainability of our commercial vehicle fleet. Stedin Group aims to achieve zero carbon emissions for our entire business mobility by 2030, accompanied by a 50% reduction of particulate matter emissions. Since early 2018, vehicles with yellow registration plates may only be replaced with a zero-emission alternative. From January 2019, this also applies to lease cars.
The replacement plan is not only driven by our own ambitions: many towns and cities are planning to create zero-emission zones in the near future. This accelerates the need for a transition to a zero-emission vehicle fleet. In 2020, to provide for the charging needs of these vehicles, we studied whether it is possible to combine the construction and conversion of low, medium and high-voltage stations with the roll-out of charging infrastructure. We will continue this study in 2021 and will examine whether we can combine this charging infrastructure with local energy generation, through solar panels on the stations' roofs, for example.
Yellow registration plates by fuel type
Electrification of our lease cars (yellow registration plates) is proceeding according to schedule. By the end of 2020, 485 of the 815 vehicles were electric.
Commercially registered vehicles by fuel type
The pace of making our vehicle fleet more sustainable depends on the supply of alternatives to carbon-emitting vehicles. This supply continues to lag behind in the case of company vans in particular. These vehicles are heavier and also travel more kilometres. At the moment, there are no electric alternatives on the market for this category of vehicle. In 2021, we will carry out several pilot projects involving electric and hydrogen-powered vans. We will also explore organisational changes that can facilitate efforts to improve the sustainability of this category. A replacement plan has been developed for large, medium and small commercially registered company vans.
Litres of fuel used and kWh consumption
We have seen a decrease in the use of fossil fuels and an increase in electric charging. In 2020, we used 804,191 litres less fossil fuels (petrol, diesel, LPG) for our commercial and lease vehicles than in 2019. Electric charging of our commercial and lease vehicles increased by 1,638,072 kWh compared to the previous year.
Commuting
Employees who have a free season ticket for public transport can travel by public transport for business as well as private purposes. In 2020, few employees used public transport in connection with the COVID-19 pandemic. We are also encouraging other sustainable alternatives at the same time, such as private lease arrangements for electric cars and a bicycle scheme. Business travel is undertaken by rail as much as possible. CO2 emissions from air travel will be compensated in the future.
Stedin Group participates in initiatives stemming from the Climate Agreement for more sustainable business mobility. We also participate in the LowCarDiet initiative.
Impact of COVID-19 on One Planet
The coronavirus pandemic has had an impact on the sustainability performance of our business operations. This is clearly reflected in mobility. Since March 2020, business travel by air has been eliminated from our carbon accounting. Business travel by car, commuting and movements in our operational context have also fallen significantly. Entirely in line with our sustainable mobility vision, we aim to avoid co-workers replacing travel by public transport at this point with private vehicles, which are often a less sustainable form of transport. Working from home has become the norm, and we are examining how to encourage bicycle use once the crisis is over (including for longer distances).
While accommodation is also impacted by the pandemic, the effects will not become apparent for some time. Even with lower staffing numbers, our buildings still require heating and lighting. The long-term effect is related to the potentially changed role of the office as workspace once the crisis has ended if homeworking remains, at least partly, the norm.
Accommodation
Stedin takes a conscious approach to its real estate. This means that we implement sustainability measures when undertaking renovation, during use as well as in relation to mobility, for example. We green the CO2 emissions from our buildings that we are unable to avoid or reduce by entering into green energy contracts with our suppliers.
In 2019 and 2020, we disposed of six locations in total. We make existing locations more sustainable wherever possible. Solar panels were installed on the roof of our office at Blaak in Rotterdam and our location in Utrecht in 2020. We also concluded a sustainable energy contract for all our locations in 2020, thereby reducing our CO2 emissions. A renewed energy management system at our Utrecht location gives us detailed insight into our internal energy consumption and enables us, for example, to adjust the climate control system to boost energy efficiency.
More sustainable office facilities and services
Our facilities partners, such as cleaning, catering and coffee contractors, contribute to our One Planet strategy, from healthy food options and cradle2cradle cleaning trolleys to plastic reduction. In 2020, we invested in two composters to reduce organic waste by 85%. In this way, we are converting our waste stream into fertile compost and reducing waste transport and processing.
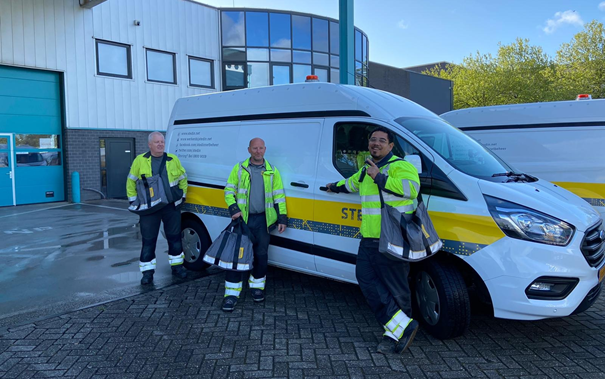
Stedin bags made of old grey fitters jackets in a sheltered workshop
Renovation of Anthony Fokkerstraat location
In 2020, the tendering procedure for the renovation of DNWG's head office at Anthony Fokkerstraat in Goes, Zeeland, was completed. Considerable attention was focused on sustainability, in terms of use of materials as well as energy and emissions, during the tender process.
The tender specified strict requirements as regards insulation, re-use of materials, measures to facilitate a green vehicle fleet and reduced energy consumption, for example. Energy label A is the starting point. In Zeeland, we are targeting the highest achievable goal, which is to meet all our energy requirements from our own sources. The aim is to close at least two other locations once the renovation of the building at Anthony Fokkerstraat is completed.
 Use of raw materials
We aim to maximise circularity both from a sustainability perspective and for business reasons. We purchase products with as much recycled raw material content as possible, challenge suppliers to deliver products that facilitate maximum recycling after the useful life has expired and work with our waste processors to ensure the highest-grade recycling. Examples include the Fair Meter and circular cables. We have agreements in place with service providers for the responsible treatment of residue streams; they collect and process these streams for us.
KPI for circular purchasing and the raw materials passport
As from 2019, we request suppliers to fill in a raw materials passport in tendering procedures for all our primary assets. This serves to ascertain the raw and other materials of which the product consists, how much recycled material it contains and the extent to which it can be recycled after its useful life.
In 2020, the 151 raw materials passports we requested from 17 suppliers mean that we made a passport request for 100% of our primary assets and obtained data on 96.5% of our primary assets. As the target for 2020 was 100%, including the assets of DNWG, we have consequently not yet met our target. The reason for this shortfall is that not all the assets ordered in 2020 will actually be taken up in 2021. Requesting a raw materials passport for these assets has been given lower priority than requesting raw materials passports for assets that will be used in 2021. The last raw materials passports from 2020 will be located as quickly as possible.
As we now have insight into 100% of our primary assets through the raw materials passports, we will focus on increasing the degree of circularity of our assets. We do this by analysing the data from the raw materials passports and by working with suppliers to explore options for increasing the circularity of assets. This can be achieved by using more recycled raw materials, for example, or by ensuring a higher recyclable percentage for an asset (high-grade recycling) after its useful life has expired. This shift in focus also means that the KPI will be changed in 2021 to '% circularity of purchasing of primary assets'. Based on our current understanding, we appear to be on course to achieve a circularity percentage of 34.7%. Our target for 2021 is 38%.
Status of request for raw materials passport based on total ordered weight (in kg x 1,000).
Focus on use of raw materials throughout the entire chain
To achieve a circular mode of operating, we also need to focus on reducing the use of raw materials in the organisation and extending the useful life of assets through re-use, among other things, and by finding high-quality and high-value applications for assets and raw materials after their useful life.
Stedin is targeting the development in 2021 of several programmes that will result in increased performance in the entire system from purchase to re-use and recycling. Circular thinking in this context leads not only to a more sustainable result but also an improved financial result.
Waste (in kg)
The table below shows the amount of waste from Stedin Netbeheer.
Waste | 2017 | 2018 | 2019 | 2020 |
|---|---|---|---|---|
Total waste by type | 6,400,386 | 8,588,912 | 9,576,136 | 8,885,295 |
Total waste disposal recycled | 5,831,399 | 7,755,969 | 8,623,144 | 7,710,474 |
Total waste disposal non-recycled | 568,987 | 832,943 | 952,992 | 1,174,821 |
% waste non-recycled | 9% | 10% | 10% | 13% |
Total asbestos | 487,730 | 771,930 | 718,550 | 756,645 |
% share asbestos in non-recycled | 86% | 93% | 75% | 64% |
Phasing out ‘SF6‘ in switchgear
SF6 is used as an insulation medium in our high and medium-voltage switchgear. The gas ensures that electrical arcs formed during switching are quickly extinguished. This property allows the switchgear to remain relatively compact, which is useful when switchgear needs to be installed in a station with confined space. SF6 has a major disadvantage, however, because an SF6 molecule has a CO2 equivalent that is 23,000 times greater than a CO2 molecule. As a consequence, SF6 is harmful if released into the atmosphere. While most switchgear is leak-proof, a limited quantity of SF6 is emitted each year. In 2020, Stedin added 5.84 kg SF6 (2019: 7.57 kg).
Stedin will purchase thousands of items of SF6-free switchgear in the coming years. Stedin needs lots of new switchgear for expanding its electricity grids and is committed to doing so in the most sustainable way possible.
One Planet governance
The Board of Management (BoM) is responsible for the ambitions and objectives that have been formulated for Stedin Group. In 2016, the BoM approved ambitions that provide direction for Stedin Group's sustainability policy towards becoming a climate-neutral organisation by 2030. The strategy and results were also discussed with the Supervisory Board in 2020.
KPIs have been formulated for the main impact categories – CO2 emissions, use of raw materials, particulate matter emissions and inclusive society – for the business units that have an influence on them. Results on the KPIs are reported to the BoM and the directors of the business units concerned every quarter. A quarterly analysis is also carried out of strategic risks and opportunities, which includes the topic of sustainability. The strategic risk 'excessive environmental impact' is not included in the Risk Management section, as this risk is managed within the defined risk tolerance.
Risks for Stedin associated with climate change and mitigation measures
We realise that there are business risks related to the effects of climate change, such as storms, floods and wildfires. The ‘Task Force on Climate related Financial Disclosures’ of the Financial Stability Board is one of the initiatives providing transparency guidelines in relation to these risks. In line with the recommendations of the Task Force, Stedin joined the ‘Climate Adaption Coalition’ in 2020. It is Stedin's ambition to continue working with the Coalition and to study the effects of climate change for our company in 2021.
Success of the loans for private solar panels scheme (PV Privéregeling)
In 2020, Stedin once again made interest-free loans available to its employees, under the work-related expenses scheme, to enable them to purchase solar panels. In total, 147 Stedin and 60 DNWG colleagues received a loan under this scheme. This facility helps to cut 200,000 kg in CO2 emissions each year.
Sustainability rating
Rating agency ISS ESG gave us a 'B' rating for sustainability in 2020. This prime rating sets us apart as one of the top performers in our sector.
Allocation and impact report for green bonds
Stedin Group issued green bonds for the first time in its history in 2019. A green bond enables money to be raised for environmentally friendly projects. Green bonds are similar to traditional bonds in terms of the way they work. Their pricing is the same, and they are traded in the regular manner on the stock market.
Stedin Group has put together a selection of green projects for which it has issued a bond loan. We invest the money raised in sustainable refurbishment of our office buildings, in rolling out smart meters and in our grid. This latter category covers connections of large wind and solar farms as well as investments that facilitate a greater input of sustainable energy. Bonds were issued for a total amount of 500 million euros. You can read more about how the money raised through green bonds is used in the allocation and impact report.
Stedin Group will continue to explore opportunities for green financing into the future, based on the Green Finance Framework, which is available on our website.
Groene Netten coalition
Groene Netten is a coalition of the eight largest infrastructure operators in the Netherlands: Alliander, Enexis, Gasunie, KPN, ProRail, Rijkswaterstaat, Stedin and TenneT. Together, we account for no less than five per cent of all the energy consumed in the Netherlands. We realise that this enables us to have a tremendous impact, which is why we have set ourselves a goal: to work together to accelerate the transition to the new, sustainable economy. We do this by collaborating on various concrete projects within four core themes: climate, circularity, biodiversity and measuring impact. Against this background, we are developing long-life cables, for example, and we are working towards 100% sustainable energy and lowering CO2 emissions.
In 2020, all the parties undertook an ‘Impact Journey’, during which the first steps were taken towards adopting socio-economic financial statements and focusing on broad prosperity. The working group also implemented transparency in the raw materials passport, and a major project was launched to examine the feasibility of joint internal carbon pricing.
New theme: biodiversity
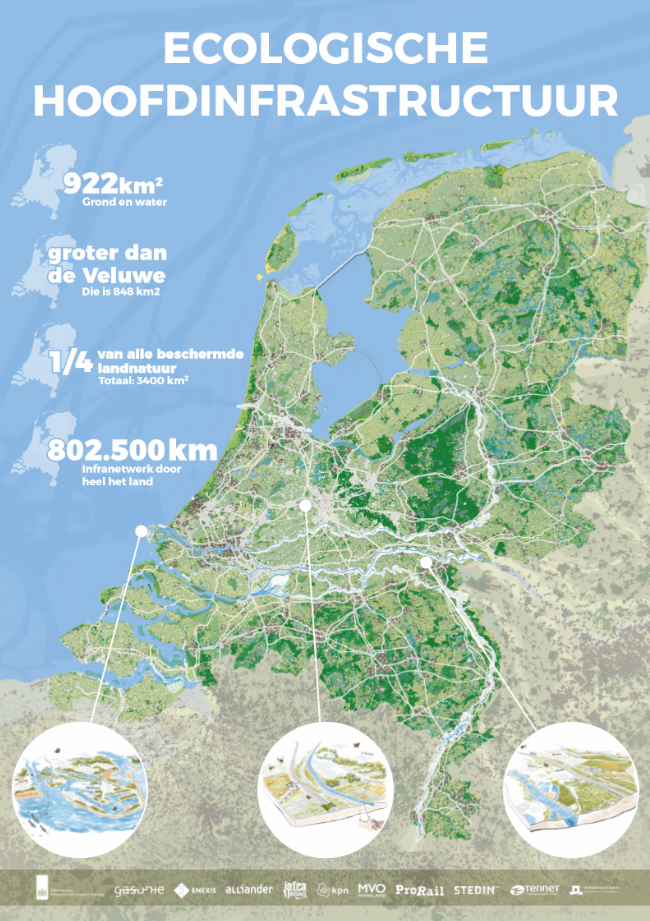
Biodiversity restoration is a relatively new topic on the sustainability agendas; the UN has proclaimed 2021 the year of biodiversity. In 2020, the Groene Netten coalition adopted biodiversity as a new theme; there is a unique opportunity to create a national ecological infrastructure by linking the multiple Groene Netten locations and sites. Stedin's area together with the land of other Groene Netten parties can play a part in ecological recovery in the Netherlands. In 2020, this prompted the development, together with Dutch Butterfly Conservation, of a new ecological main infrastructure, which sets out that Groene Netten parties jointly manage 922 square kilometres of land and water – more than the Veluwe national park and a quarter of the land-based nature in the Netherlands. This is spread across an infrastructure network covering 802,500 kilometres.
In 2020, the strategy was developed that Stedin intends to follow as regards this new topic, the first projects were identified and a start was made with 'no-regrets' measures. The programme will be further developed by Stedin and Groene Netten in 2021, and we will launch three major projects across the country.
Detailed information on CO2 emissions by Stedin Group
The comparative figures for 2019 and 2018 have been adjusted for emission factors (source: www.co2emissiefactoren.nl) where applicable. The energy intensity ratio is the energy consumption (in GJ) divided by annual revenue (in million €). The GHG emission intensity ratio is the total greenhouse gas emissions including greening (in tonnes CO2eq divided by annual revenue (in million €).
Transport | Unit | 2018 | 2019 | 2020 |
|---|---|---|---|---|
Transport of electricity | GWh | 21,330 | 21,100 | 20,171 |
Transport of gas | million m3 | 4,852 | 4,651 | 4,365 |
Energy intensity ratio | Unit | 2018 | 2019 | 2020 |
|---|---|---|---|---|
Energy consumption | GJ | 233,927 | 182,168 | 157936 |
Annual revenue | € million | € 1,268 | € 1,234 | € 1,228 |
Energy intensity ratio | GJ/€ million | 184.5 | 147.6 | 128.6 |
GHG emission intensity ratio | ||||
|---|---|---|---|---|
Scope 1 | Unit | 2018 | 2019 | 2020 |
Gas consumption of buildings | tonnes CO2eq | 635 | 454 | 458 |
Leakage loss of natural gas grid | tonnes CO2eq | 42,719 | 42,181 | 41,949 |
Lease & company cars | tonnes CO2eq | 10,193 | 8,856 | 7,311 |
Total | tonnes CO2eq | 53,547 | 51,491 | 49,718 |
Scope 2 | Unit | 2018 | 2019 | 2020 |
Electricity/heat consumption of buildings | tonnes CO2eq | 826 | 238 | 1,168 |
Electricity grid losses | tonnes CO2eq | 432,364 | 433,167 | 386,264 |
Total | tonnes CO2eq | 433,190 | 433,405 | 387,432 |
Scope 3 | Unit | 2018 | 2019 | 2020 |
Commuting, business trips, flights | tonnes CO2eq | 3,735 | 3,419 | 1,818 |
Total | tonnes CO2eq | 3,735 | 3,419 | 1,818 |
Total | Unit | 2018 | 2019 | 2020 |
Total footprint | tonnes CO2eq | 490,472 | 488,315 | 438,968 |
Greening | tonnes CO2eq | -432,364 | -433,167 | -386,264 |
Total including greening | tonnes CO2eq | 58,108 | 55,148 | 52,704 |
Annual revenue | € million | € 1,286 | € 1,234 | € 1,228 |
GHG emission intensity ratio | tonnes CO2eq/million € | 45.2 | 44.7 | 42.9 |

Crucial craftsmanship: Dave de Wit
Dave de Wit is a gas-free specialist. What does 'crucial craftsmanship' mean for him? 'Ensuring a healthy mind in a healthy body.'
>What makes your work of vital importance? In other words, why is your work important for society?
'My work focuses on the safety of gas grids, and together with my team, I remove gas pipelines that are no longer in use. This can be because customers have switched to another energy source, for example. These types of pipe remain pressurised, which can give rise to dangerous situations They need to be removed. Many customers are fine with that, but they are not so happy when they hear that this involves digging up their garden. We are currently developing a pipe puller, which will enable us to extract the pipe without having to dig a trench and with minimal damage to the garden, other than a hole in the outer wall. We are now conducting a pilot project. Customer response has been very positive so far.'
>How do you recognise a professional in your field?
'A strong sense of safety and customer experience is a key priority. Creativity within the framework of safety is also important. We come across countless different situations in our work, from gas meters behind sofas to ones installed in small sheds next to houses. If you have a solution for all these types of situation, that makes you a true professional '.
>What has working been like for you during the lockdown? What was different from normal?
I have worked for Stedin for more than 40 years, and I'm just not used to working from home. It does save a lot of travel time, though. Quite often, I'd be stuck in traffic from where I live. That is one thing I definitely don't miss. I do miss my colleagues – communicating on a little screen is not the same. Keeping your distance when working on the pipes outside also takes some getting used to. Sometimes, you come across something you want to show someone, and then you find yourselves standing too close together before you realise it. That is why we've agreed to keep each other on our toes.'
>How do you ensure that you remain fit and healthy yourself?
'I work out for half an hour every morning on the spin bike, which has a TV screen, in my garden shed. We also have a large dog who needs taking out for long walks three times a day. My wife and I take turns doing this. I have always done a lot to keep fit, and then, suddenly and unexpectedly, I had a heart attack two years ago. It was touch and go; the ambulance arrived just in time. That's a sign that something is not right in your body. I took it as a warning signal and a prompt to make extra sure to get enough exercise, at work and when at home.
>What gives you the most satisfaction in your work? How does your work help you maintain vitality?
'Pioneering, trying to solve things, making the transition from policy to practice – these are the things that give me satisfaction. The pipe pulling project also includes several young fitters from the in-house training school. Innovation projects like this provide them with a great learning ground, and we learn from them as well. They're not yet stuck in a certain way of thinking, which helps them come up with good ideas. That is great to see.'
